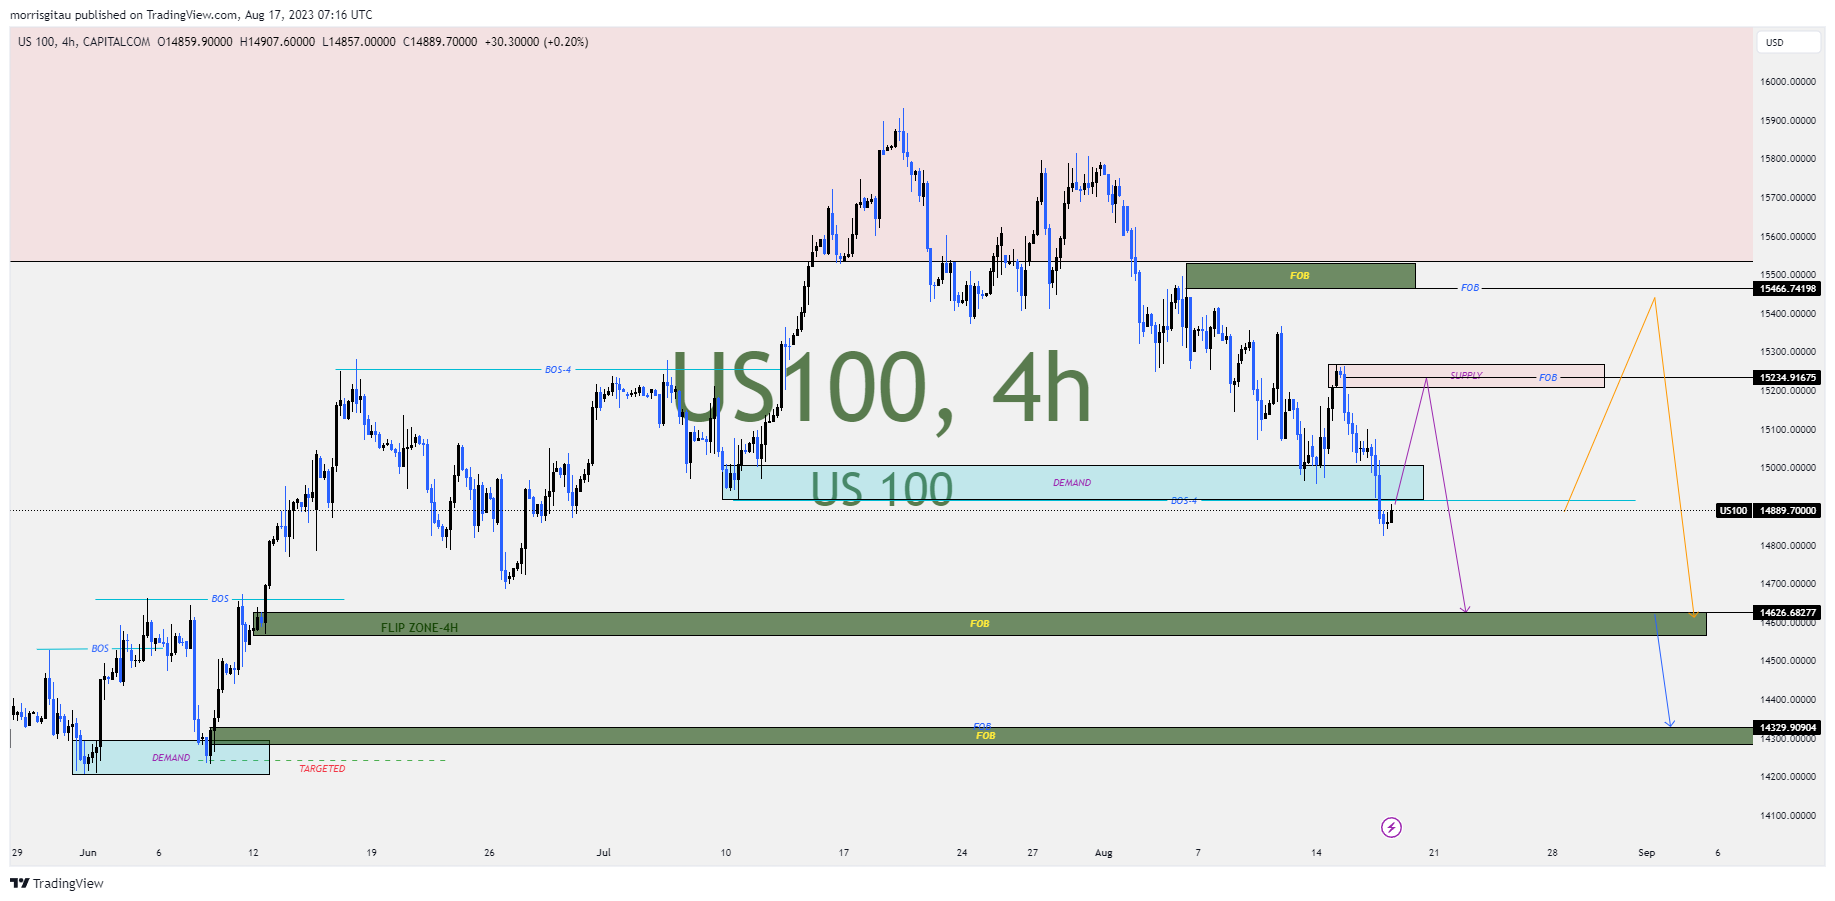
US 100 Index
Investors reaction to disappointing data from China’s economy is reflected in the bearish momentum we are presently witnessing. We have a break of a previous flip zone which informs our bearish outlook of this index. We have two possible entry points; 15234 and 15466. I favour the former entry targeting to exit at 14626 or 14329 if I am patient.

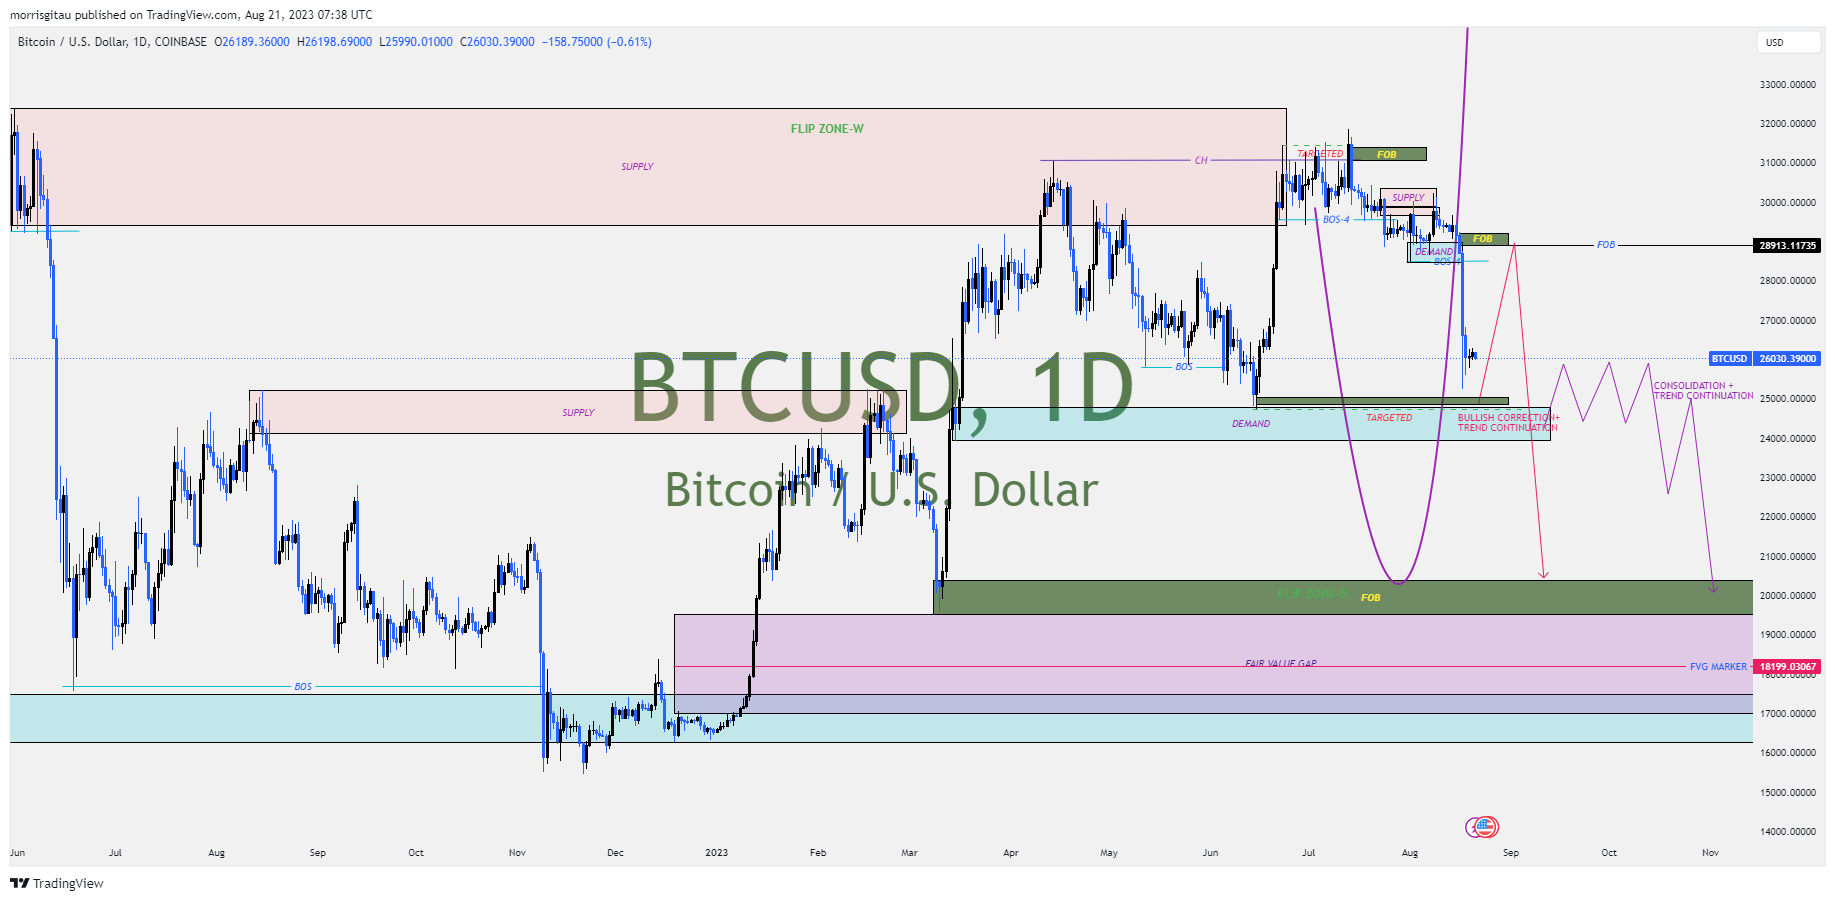
BTCUSD
Following the poor economic data from China and the bankruptcy fears , the dollar appears to be a safe haven for most investors. The bearish slide of BTCUSD confirms this. Presently, we have two option so how to trade BTCUSD. First option is a bullish correction targeting the 28913 price handle where we have a sell limit order placed. Second option is a possibility of a consolidation near the demand zone before a break to the downside. We do not have a viable sell limit for the second option.

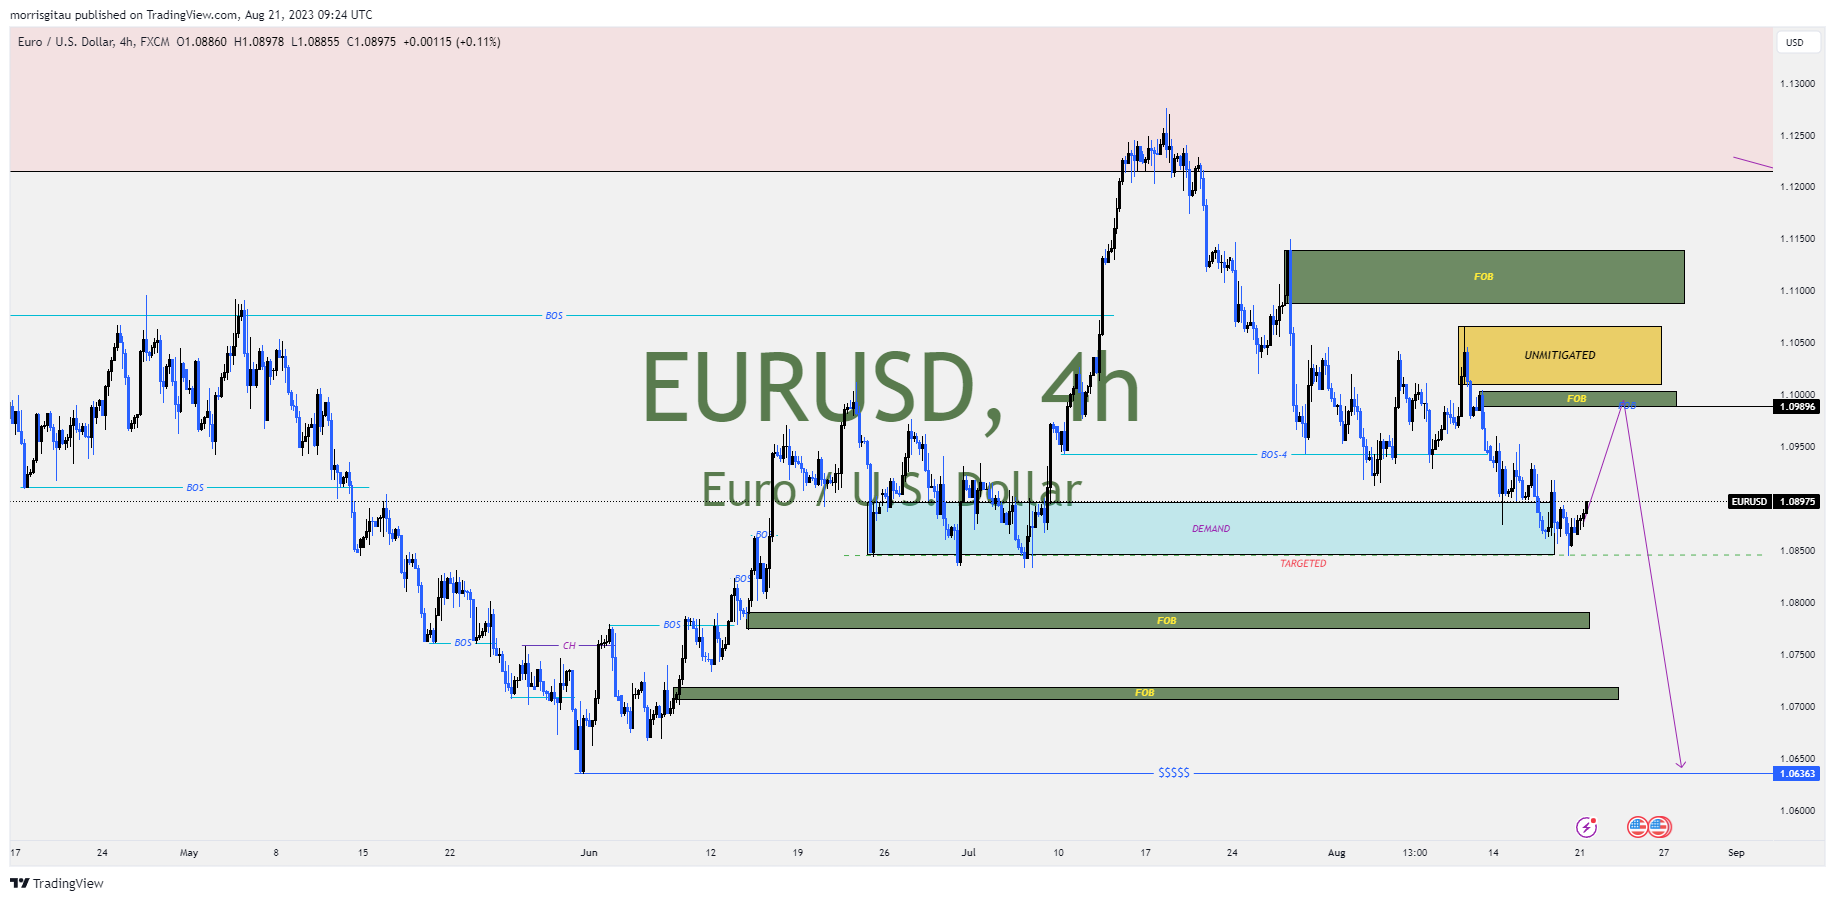
EURUSD
The strong resurgence of the dollar in the second half of the year has created bearish trading opportunities for cross USD pairs. Presently, EURUSD has reversed from the gains made earlier. I am anticipating a bullish correction targeting the fresh order block at 1.09896 or the unmitigated region sitting above. Sell limit is placed at the 1.09896 with the exit targeted at the liquidity sitting below at 1.06363.

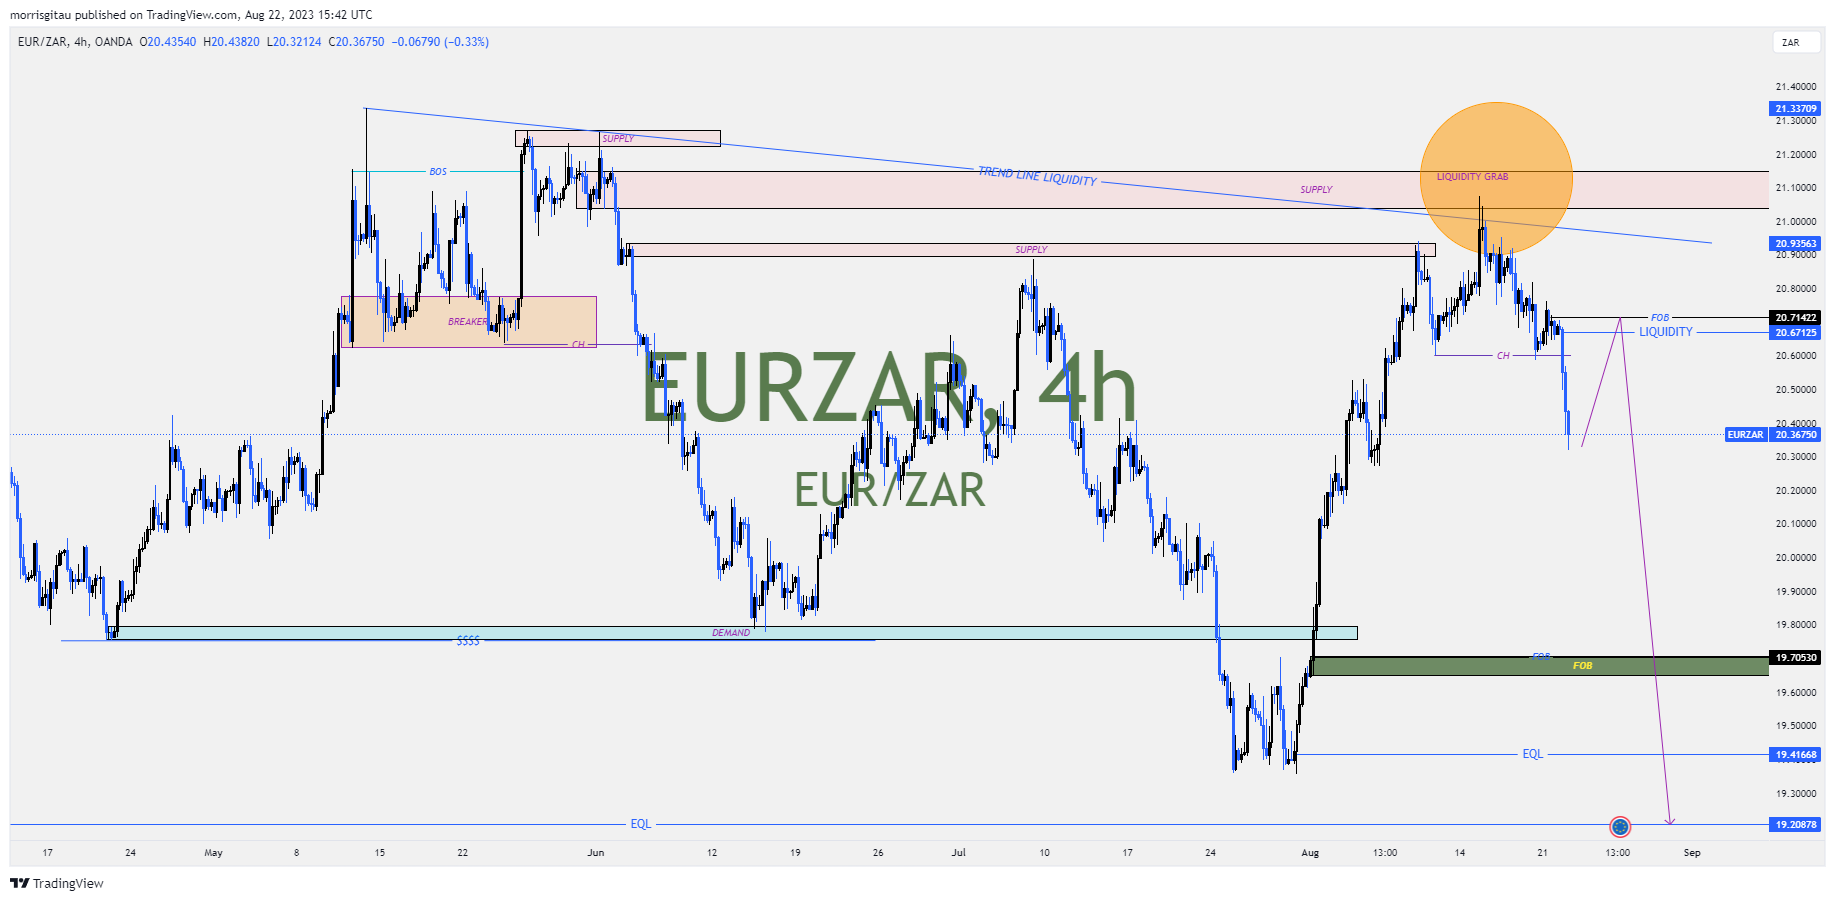
EURZAR
For the better part of the year, the South Africa Rand has weakened against major currencies. Q2 we saw a reversal. Presently we have completed a bullish correction that grabbed the trend line liquidity. We have or sell limit orders placed either at the liquidity level of 20.67125 or unmitigated supply at 20.71422. Our projected exit is the liquidity sitting below the equal lows at 19.209.

Leave a Reply