

FOREX OUTLOOK 2024
Here are my thoughts on the forex outlook 2024. We have had multiple pairs showing signs of reversal and continuation. I will use supply and demand concepts to analyze where I think the market will head in 2024.
GBPUSD
On the monthly charts we have a long term bearish scenario. After a break of structure, the price hit the demand zone and corrected for the better part of 2023.
Moving down to the weekly charts, we see a mitigation of a previous supply, thereafter there was a reaction to the downside creating a bearish order flow.
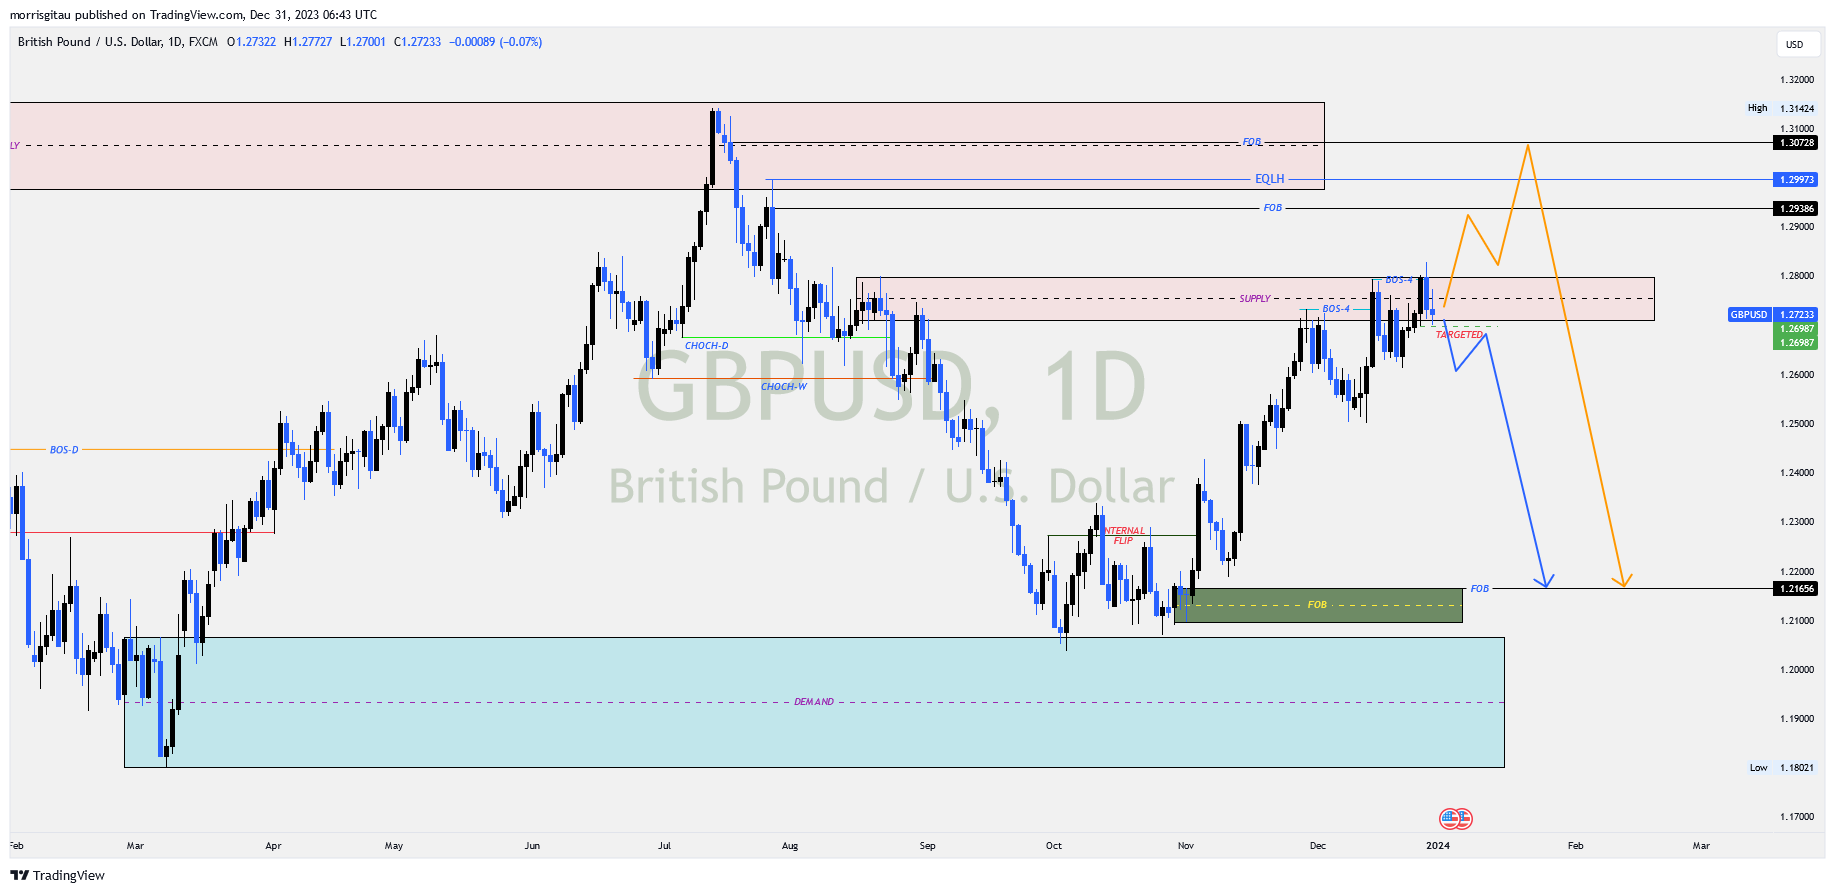
On the daily charts, we have correction that seems to have come to an end. We have a bearish bias with no confirmation. We are awaiting for a break of key price levels to confirm our bearish outlook. If that happens, we are targeting the demand at 1.21656.
Should the market break higher, we are awaiting for it to settle at 1.20-1.30 price levels.
AUDUSD
On the monthly chart we have a bearish long term outlook. The price completed a correction at 0.90-1. Thereafter we are in a bearish continuation on the monthly chart.
On the weekly charts, we are nearing the end of a bullish correction that may reverse or continue slightly higher. Looking closely, we also seem to be in a consolidation awaiting a proper breakout, our bias presently is a bearish set up though we do not have confirmation.
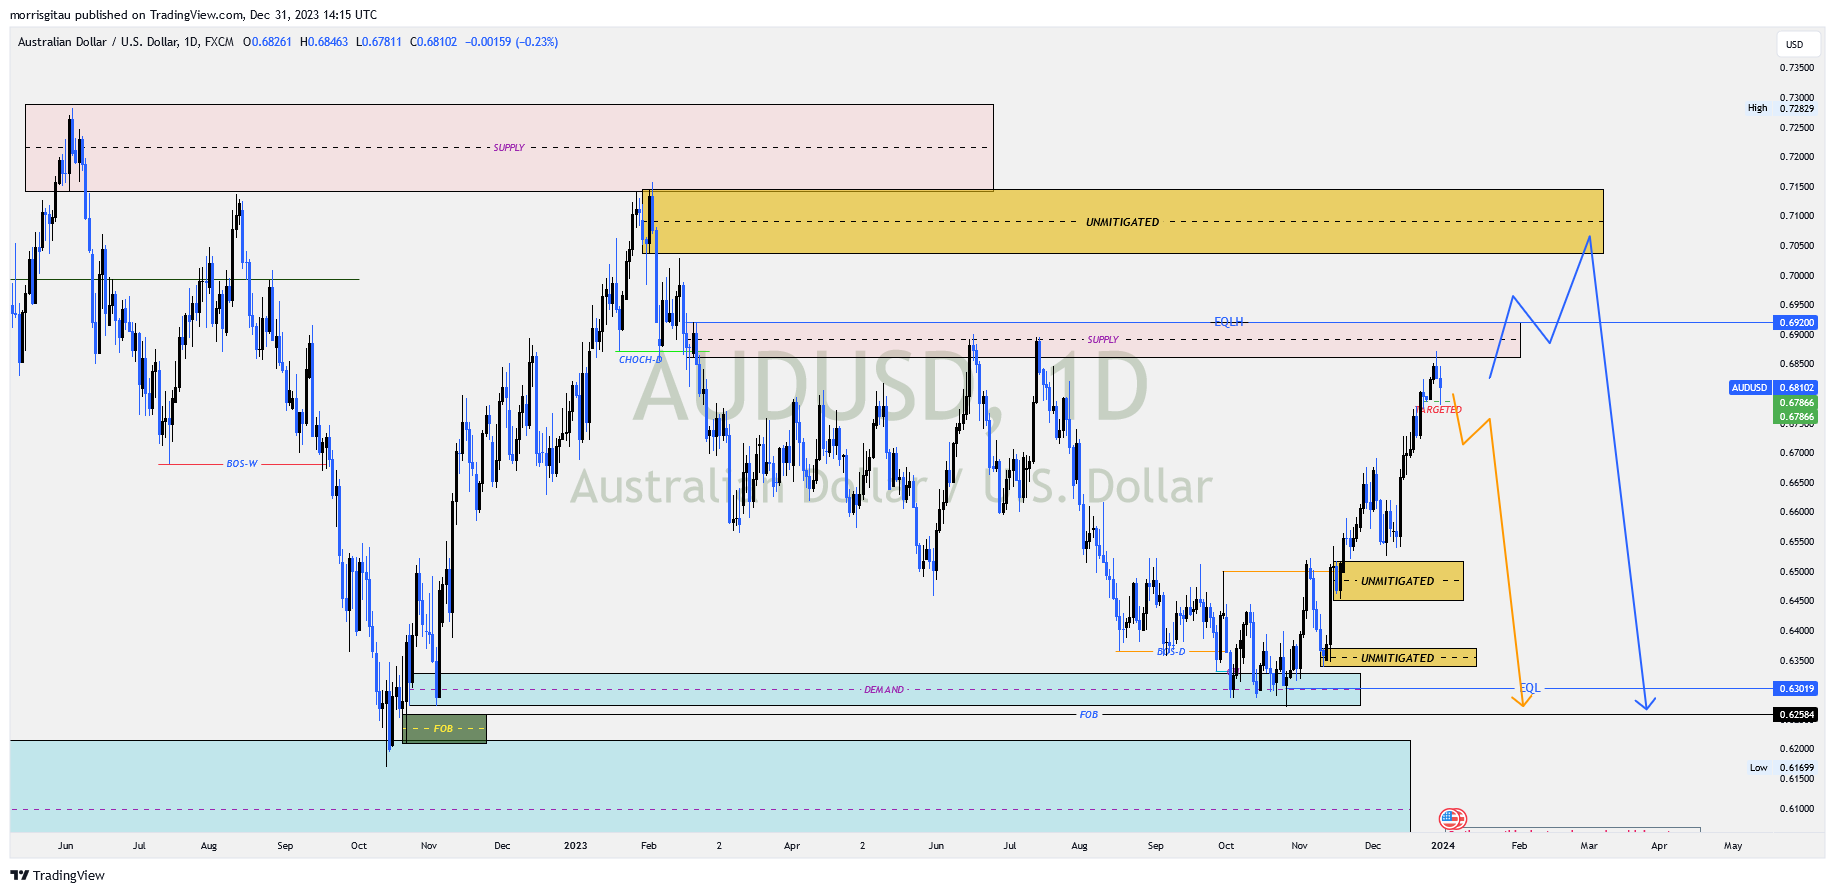
Presently, on the daily charts, we are waiting for a clear direction, either a break to the upside targeting liquidity at 0.692 or higher targeting the unmitigated supply at 0.7. Alternatively, we could have a break to the downside targeting the liquidity at 0.63 or fresh demand at 0.626.
USDJPY
On the monthly chart, the price has completed a long term market correctio. We have seen a reaction from the monthly demand indicating order flow has shifted to bearish.
On the weekly charts, we have an internal shift in order flow and a correction that is complete confirming our long-term bearish outlook.
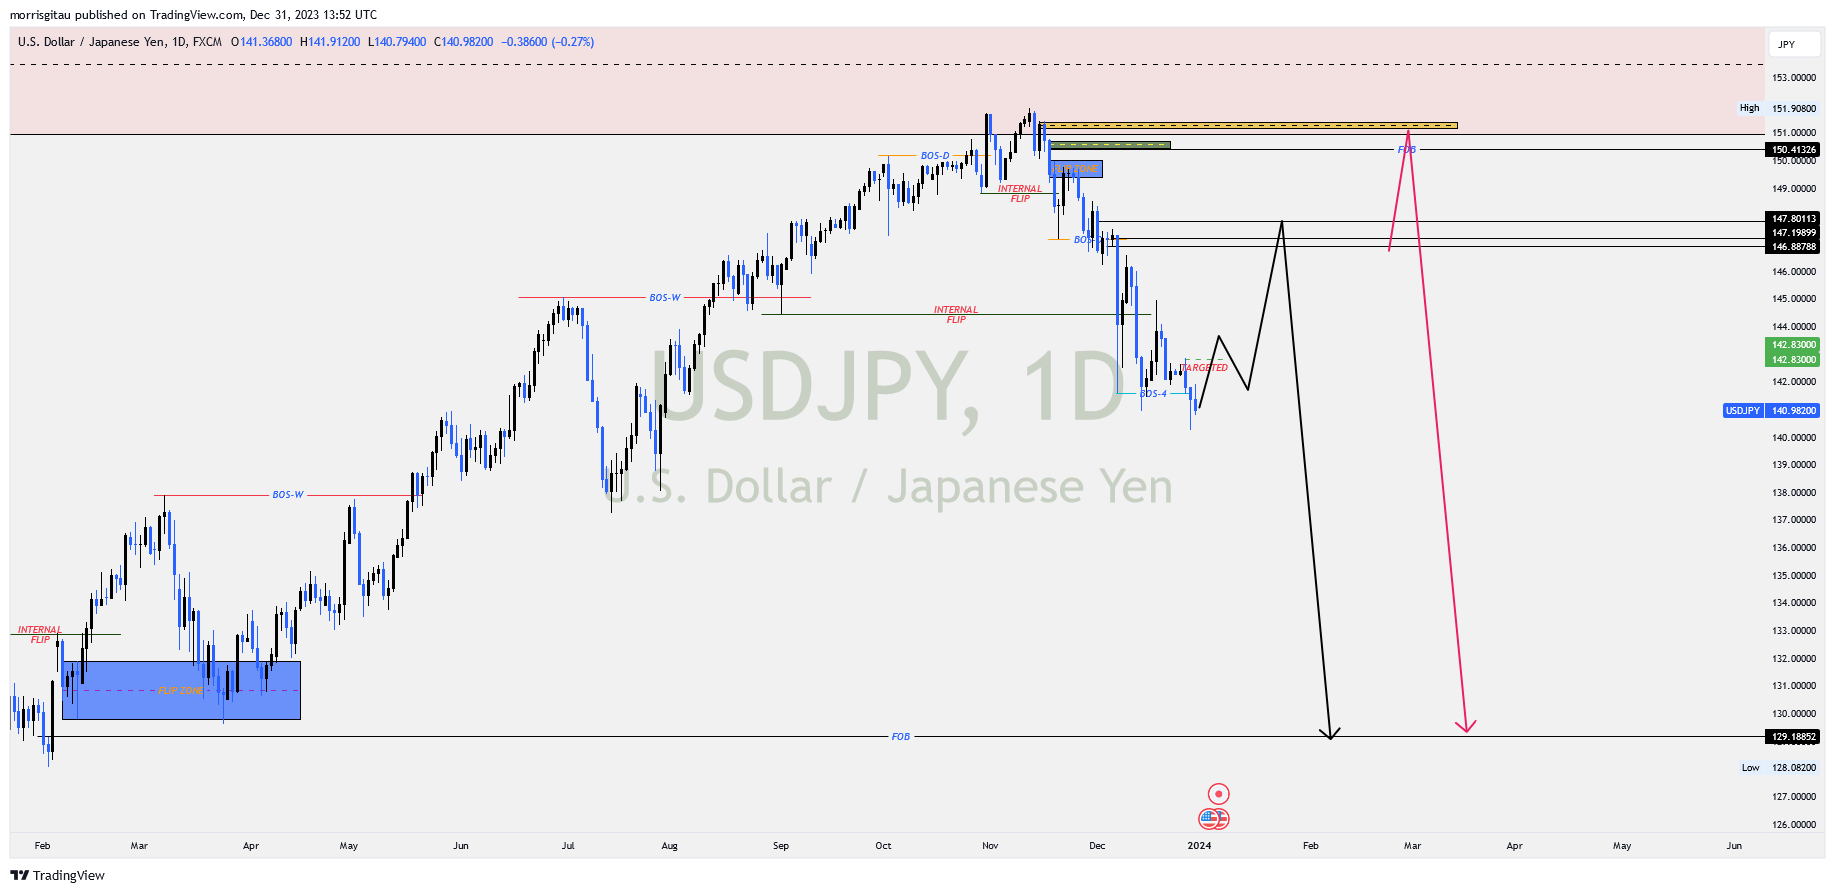
On the daily charts we anticipate a correction to mitigate the 146-147 region, there is a possibility the market might go higher so we will wait for confirmation for either buy limit targeting 146-147 or sell limit from the same region or higher.
GBPCHF
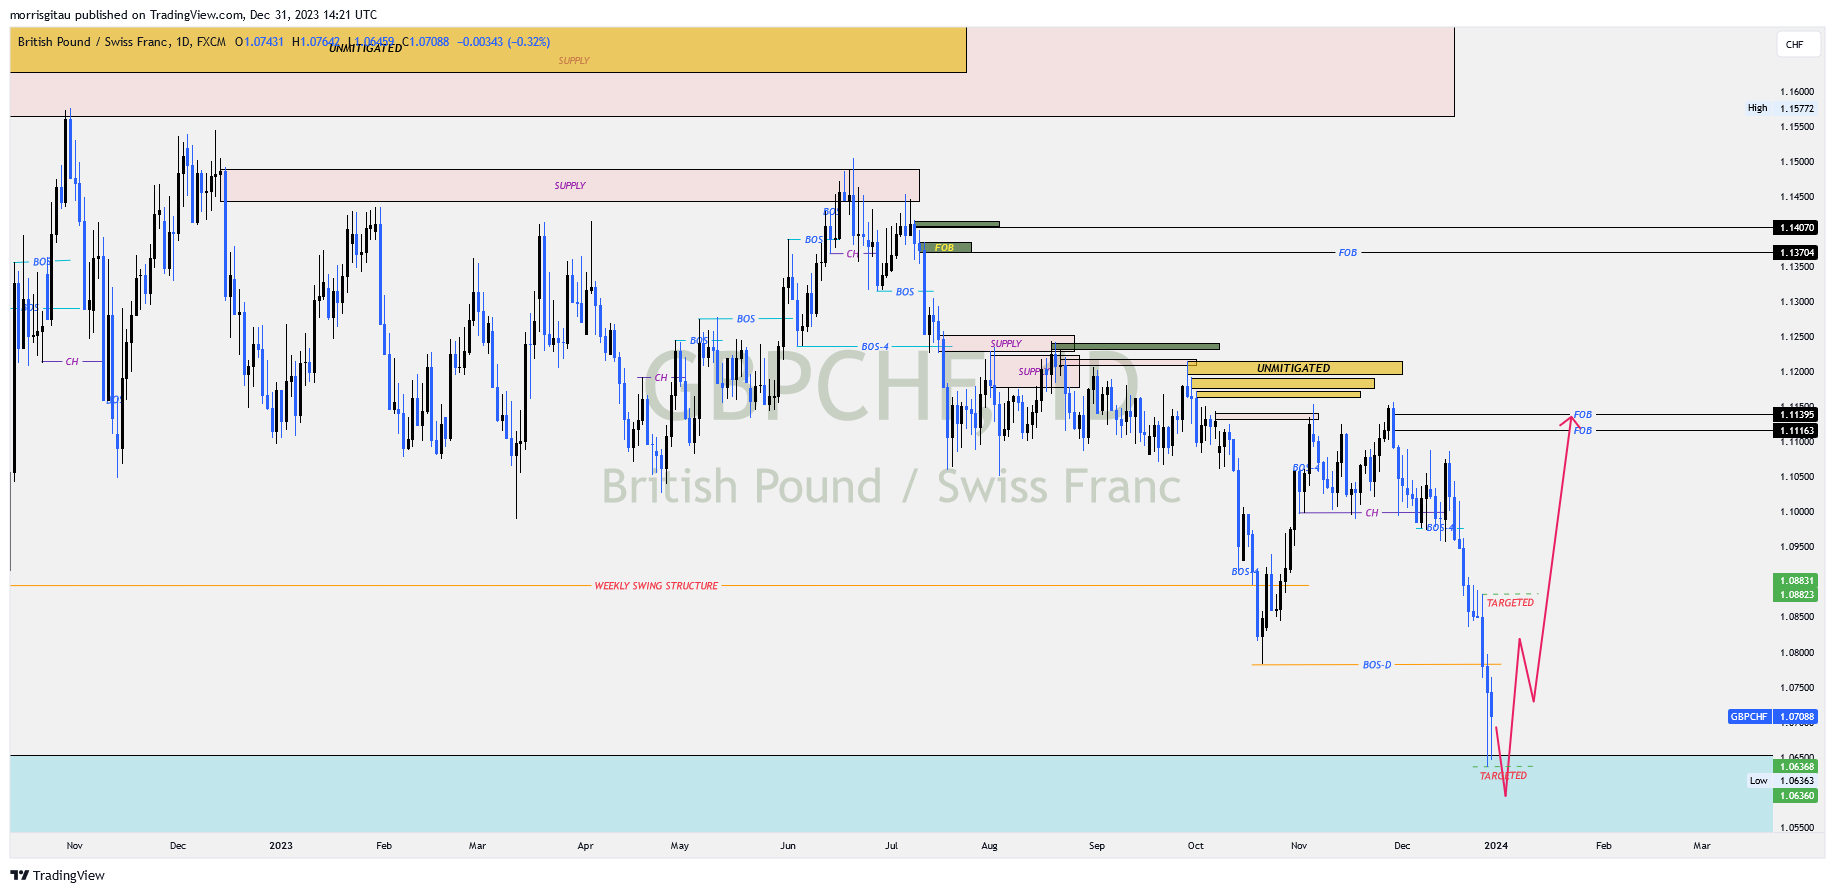
Cross Swiss Franc (CHF) pairs remained subdued for the better part of 2023. Towards the close of the year we saw signs of recovery though it was short lived. On the monthly chats, we have a break of structure, consequently, we are yet mitigate the supply at 1.20, that informs our bearish bias.
On the 4 hour chart, we are yet to get a clear confirmation though we anticipate the price will break lower before reversing to the projected upside of 1.11 -1.13
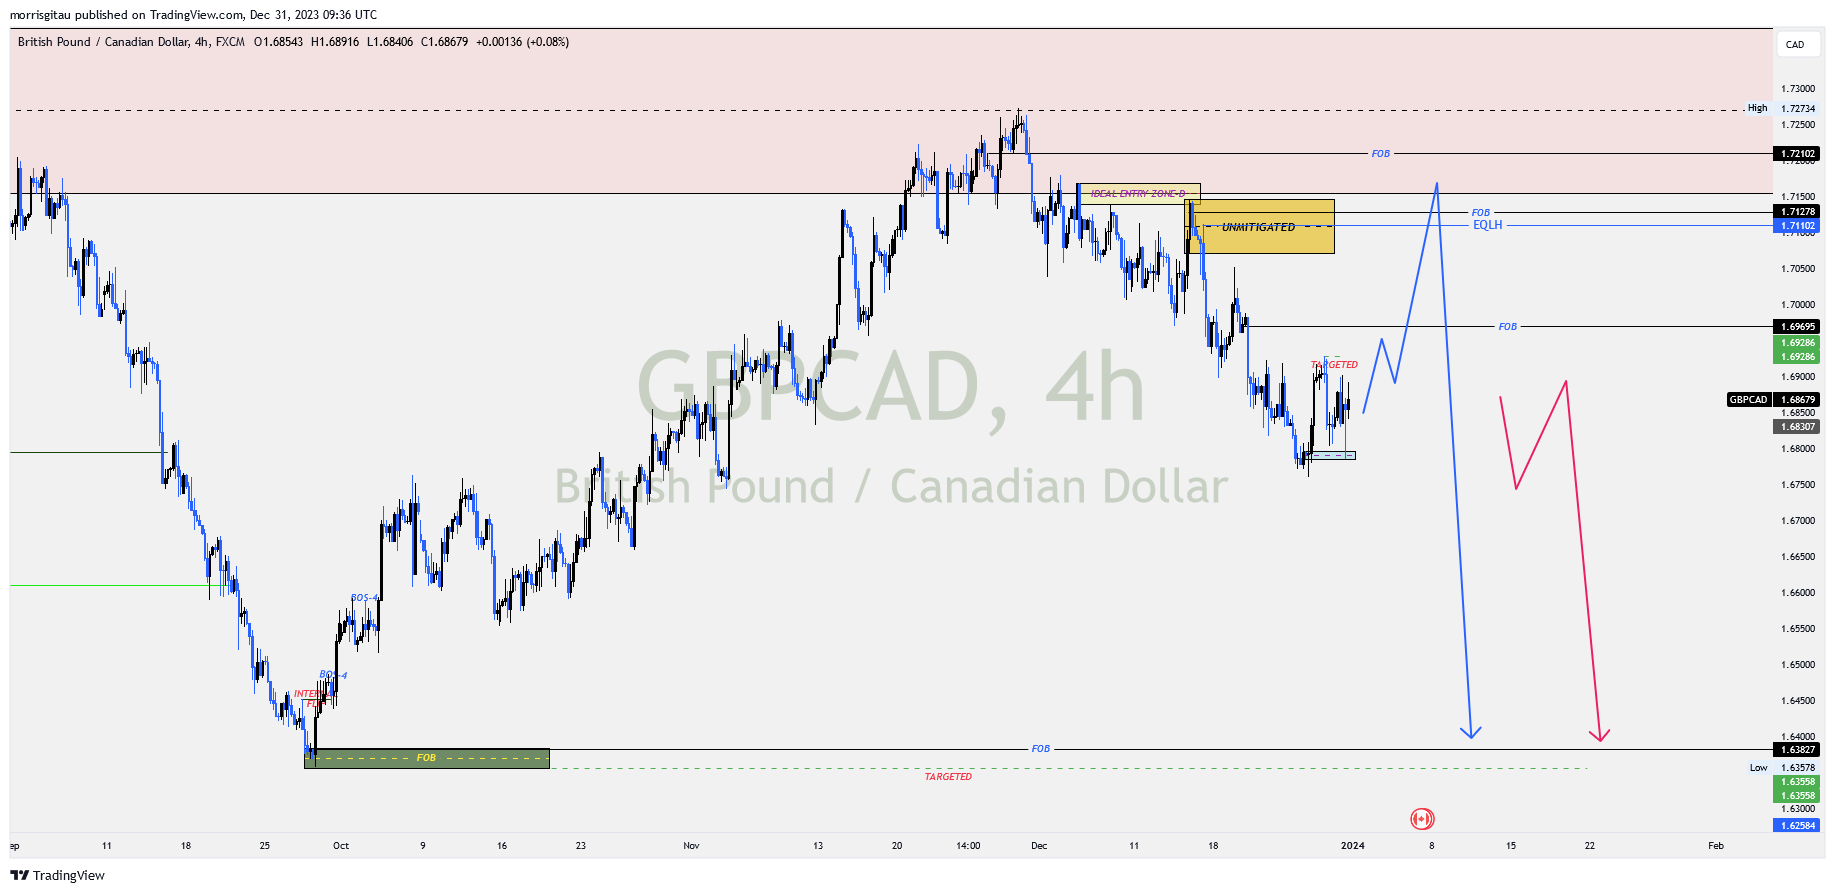
GBPCAD
A resurgent British pound and declining oil prices have resulted to a strong bullish move on the monthly chart that has mitigated a previous supply.
Presently still on the monthly chart we are registering strong bearish orderflow.
Presently on the 4 hour chart we are awaiting confirmation, a bearish continuation or a minor bullish correction targeting the unmitigated supply above before a bearish continuation.
Join my premium forex channel for exclusive access to swing trading set ups.